December 16
COLLABORATION:
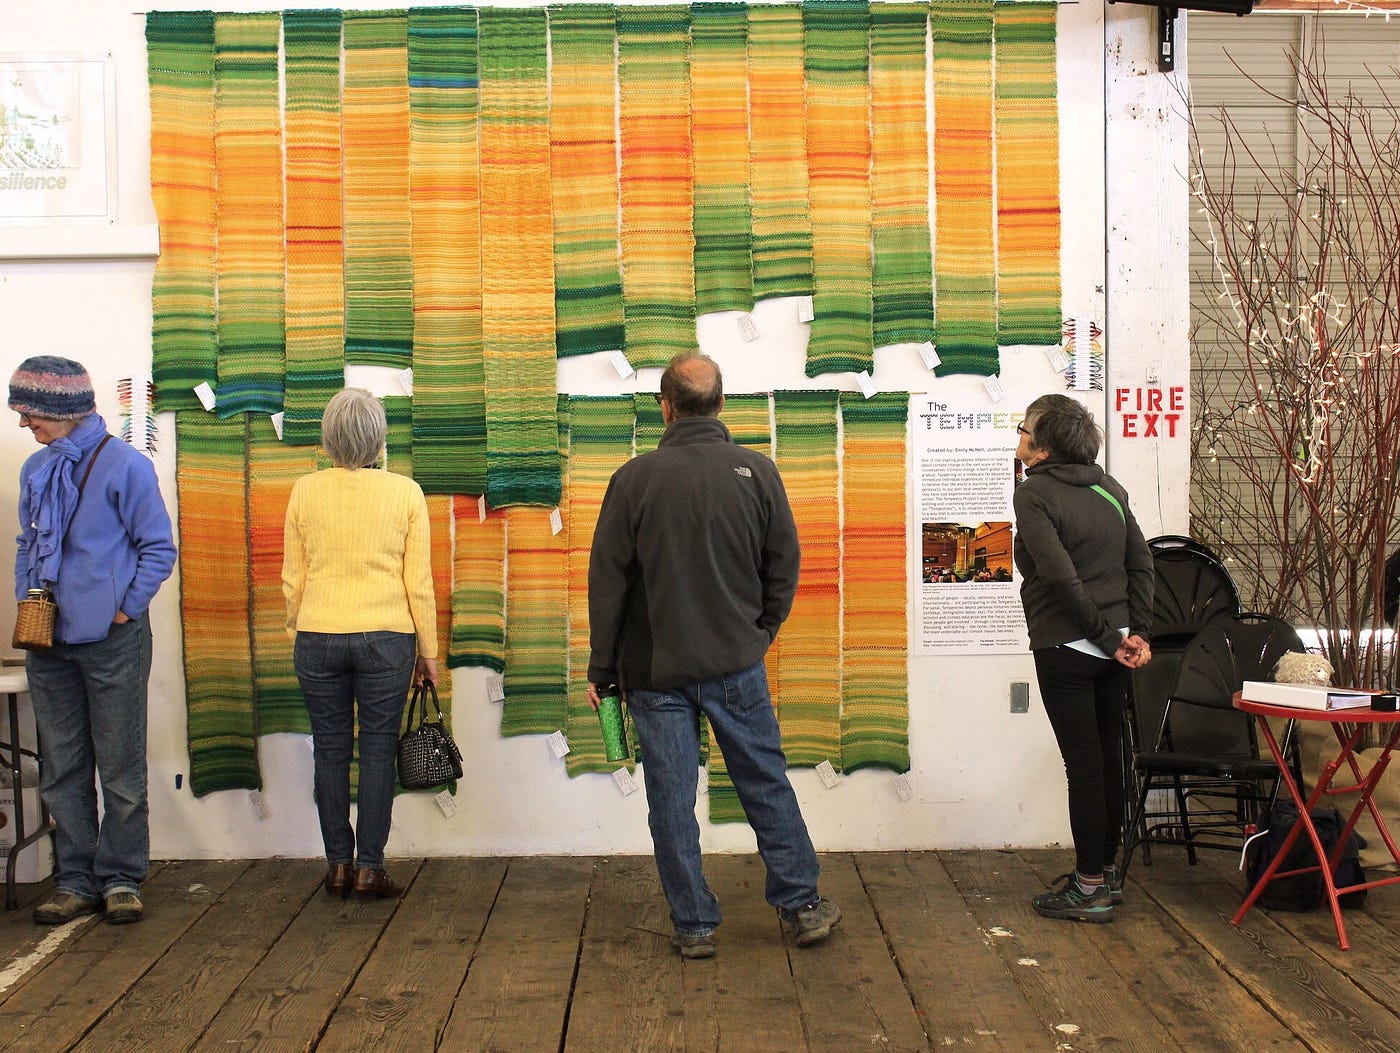
TEMPESTRY PROJECT
In 2015, Marine biologist Joan Sheldon crafted a tunisian crochet scarf depicting average temperatures on Earth from 1600-1900 (see on Ravelry here). Though she was aware that it would look very different as she came to the end of her scarf (and the close of the 1800s), the visual of the scarf – and the tactileness of the process – really brought it home. She shared her scarf at a conference and was stunned by the response of scientists, obviously familiar with the climate crisis, but who were quick to want to touch the data. “They never would [do this] with a science graph,” Sheldon says. But the fiber depiction “approaches you in a different way.”
Inspired by projects like Sheldon’s, Emily McNeil & Marissa Connelly co-founded the Tempestry Project in 2017. The project has grown beyond any individual fiber artist to include a “sprawling community of friends, artists, crafters, teachers, scientists, activists, nature lovers, and more.”
In 2020, Josie George, a fiber artist and photographer tweeted about her year of temperature data scarf (or “tempestry”). Her post went viral, and as the pandemic progressed, more folks began starting their own with yarn or fabric…all stitching and visualizing with fiber, our climate crisis.
“As more and more people create Tempestries, both individually and in geographic collections, a mosaic of our climate history is beginning to emerge.”
─Tempestry Project
Links for Further Exploration
- Tempestry project website
- Original Sheldon scarf from 2015
- Article: Crafting takes a dark turn in the age of climate crisis
- Podcast episode & Article, including conversations with Emily McNeil and Justin Connolly, founders of the Tempestry Project
- Colossal article: People Are Knitting, Crocheting, and Weaving Tangible Records of Temperature Changes
- Interview: Artist Knits “Temperature Scarf” To Track Climate Change Every Day for a Whole Year
- Very Pink Podcast episode about the Tempestry Project
- Crafting Data: Harvard/MIT workshop
- Related Knitting Data project: Councillor’s colour-coded knitting shows ‘men talk too much’
- Another Interesting Project: Wool & Water Project – using fiber arts in relation to the water shed

Invitation to Creativity
We’ve been exploring a bit about the layer that is added to the creative process when you document it. With the Tempestry Project, the final created object itself is “the document,” a record of gathered data. Much like the marks on a closet door capturing the height of growing family members over the years becomes its own visual story.
Looking back at the past 15 days, find a set of data collected by one of your devices: steps walked, screen time, hours slept, etc. Determine what the range of data might be: 0 to ?? Choose a way to “craft” this data into visual form (could be knitting, crochet, weaving, collage, etc.). It’s up to you. After visualizing the past 15 days, you can decide whether to keep recording the data for the rest of the month. What does your crafted data reveal?